Sheng Xuanhuai (1844-1916), a powerful and resourceful merchant, politician, banker, diplomat, philanthropist, and educator, was the driving force of China’s industrialization and modernization during the late Qing to early Republican period.
The Sheng Xuanhuai Archive at the Chinese University of Hong Kong was acquired by the Art Museum in 1985, under the auspice of the late Dr. J.S. LEE and Mr. CHENG Chi. It comprises 77 volumes with almost 4 million characters in over 13,000 correspondences among Sheng Xuanhuai, his family members, and colleagues. The archive is key to understanding that period of seismic changes, and it will revolutionize the study of late Qing and early Republican China.
Upon the completion of this important phase of digitisation and transcription, the Art Museum and the Library jointly organised this event to mark the occasion. The Shanghai team will share their experience on the transcription work of the archive and the potential research value. The Library’s Digital Services team will talk on the hosting of this archive on the Digital Repository to enhance discoveries, research and experimenting digital humanities.
Date: 7 Dec 2018 (Fri) Time: 2:30-5:30 p.m. Venue: Digital Scholarship Lab, G/F, University Library Medium: Chinese Registration:https://goo.gl/forms/jA4PrlOz5VYefjJl1
Speaker:
Mr. FENG Jinniu (Chief Editor of the project)
Mr. GAO Hongxing (Member of the Shanghai expert team)
Mr. Jeff LIU (Digital Services Librarian)
Program:
Opening Remark by: Prof. Josh YIU(Director of Art Museum) and Ms. Louise JONES(University Librarian)
Mr. FENG Jinniuon "Research Value of the Sheng XuanHuai Archive @ CUHK"
Mr. GAO Hongxingon "Sheng XuanHuai and Disaster Relief"
Mr. Jeff LIUon "Unveiling the Sheng XuanHuai Archive @ CUHK Library’s participation"
Q & A Session moderated by Prof. PUK Wing Kin
Associate Professor, Department of History
Closing Remark by: Prof. LEUNG Yuen Sang
Professor of History Department;
Former Director of Institute of Chinese Studies
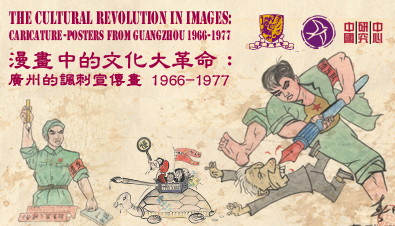
The Library is proud to partner with Dr. Laura Pozzi, Lecturer of theCentre for China Studies, to launch this new digital collection, “The Cultural Revolution in Images: Caricature-Posters from Guangzhou 1966-1977”. Through high-definition digitization, the collection showcasing 216 original posters from the Library on the Cultural Revolution is now available online to the academic community throughout the world. With the curation effort of Dr. Pozzi, all the posters were meticulously classified and the collection is organized into two sections: the first entitled “Caricature Posters of the Cultural Revolution in Guangzhou” showcases posters dated between 1966 and 1967; the second section entitled “The End of the Gang of Four” presents posters dated between 1976 and 1977. The posters are then divided according to their content, mostly the identity of the politician they targeted. All the information about each image (author and date of production) together with a translation of texts and slogans contained in the posters are accessible by either clicking the individual poster or mouse over an individual poster in each section.
According to Dr. Pozzi, most of the pieces showcased in this collection are satirical caricatures against party leaders drawn in Guangzhou during the Cultural Revolution. This satirical content sets them apart from most known images of the Cultural Revolution, which are mainly propagandistic. It is hoped that this unique and valuable collection will be helpful to scholars in their research and teaching.
The Library is pleased to collaborate with Centre for Entrepreneurship in arranging a series of workshops - Innovation Skills Workshops: Applying Digital Tools in Telling Stories with DATA from March to October 2018. The series consists of 3 workshops well-structured for equipping participants with the skills to combine computational methods with narrative approaches using data to develop web applications for scholarly and creative works. Popular digital tools like Python will be covered.Each workshop consists of 9 hours with theories and practices, starting on Friday night and end on Saturday afternoon:
Workshop 1: Design Thinking Meets Computational Thinking - Digital Literacy in the Network Age
Workshop 2: Preparing and Exploring Your Data in Python
Workshop 3: Visualizing and Publishing Your Data in Python
Welcome CUHK Faculty members, researchers and all students to jointhis workshop to equip yourself to tell impactful stories with data. Please also keep an eye on the other two workshops. Certificate of Attendance will be issued for participants who have attended ALL THREE workshops.
Workshop 1: Design Thinking Meets Computational Thinking - Digital Literacy in the Network Age (9 hrs) (will be held on 23-24 March 2018 (Fri–Sat))
a. T-shaped Talent and Digital Literacy
From I-shaped to T-shaped: Talent development for the network age
Design Thinking meets Computational Thinking: A STEAM approach to digital literacy
Lessons from “Digital Humanities”: C.P. Snow, Nicholas Negroponte, and Lev Manovich revisited
Telling story with data: From data scraping to data visualisation and interaction
Date & Time: 23 March 2018 (Fri), 6:30 p.m. – 9:30 p.m.
b. The Big 3 of web publishing
HTML - the noun in web publishing
CSS - the adjective in web publishing
JavaScript - the verb in web publishing
Using Git, Bootstrap library and Pingendo Builder for web development and publishing
Date & Time: 24 March 2018 (Sat), 10:00 a.m. – 1:00 p.m. & 2:30 p.m. - 5:30 p.m.
Workshop 2: Preparing and Exploring Your Data in Python (9 hrs) (tentatively in mid-May to early June 2018)
a. Preparing (pre-processing) your data for growth (3 hrs)
Know your sources: interviews, field studies, open data, API, websites, IoT, and digital archives
ETL (extraction, transformation, and loading) in CSV, XML, and JSON formats for data preparation
Finding a home for your data - cloud computing and its infrastructure for growth and support
Popular tools for data preparation (e.g. Knime, Open Refine, Google Sheet/Xpath, Scrapinghub, Beautiful Soap, and Scrapy)
b. Exploring your data in Python (6 hrs)
Using Anaconda Jupyter Notebook for data exploration in Python
Introduction to Python operations (operator and operand), control structure, data structure, and function
Useful Python modules for data exploration, analysis and mining (Mathpotlib, Numpy, Pandas, etc.)
Free online resources for self-paced learning in Python (codeacademy.com, coursera.org, udacity.com, cognitiveclass.ai, etc.)
Workshop 3: Visualizing and Publishing Your Data in Python (9 hrs) (tentatively in mid-September to early October 2018) a. Growing your data in the cloud: From Google Sheet to Airtable (3 hrs)
Beyond Google Sheet — Building relational database in Airtable for storing and managing your data
The power of views — Displaying and filtering data in form, grid, calendar, kanban, and gallery views
Functions and API for more advanced data modelling and application development
Integration with other web applications for team collaboration and project management
b. Data Visualisation in JavaScript (3 hrs)
Front-end vs. back-end programming: interface with the user and interface with the data using the Python Flask framework
Useful JavaScript libraries (jQuery, D3, Mpld3, Leaflet, etc.) for data visualization and front-end interactions
Create your first interactive chart in Matpotlib and Mpld3
Create your first interactive map in Leaflet
c. Publishing Your Project on the Web (3 hrs)
The elements of user experience in web design
The narrative components in user journey within a web design
Combining Airtable and Bootstrap library for web publishing
Use of Google Optimize and Google Analytics to track your web project
Venue:Digital Scholarship Lab, G/F, University Library Registration:Click to register (for workshop 1) Remarks:Users are required to bring their own devices to the workshop. Enquiries:dslab@lib.cuhk.edu.hk.
Digital Scholarship Consultation Hours service has been commenced since October 2017 to provide instant discussion and advice to any walk-in users with questions on:
Software and tools in the Lab such as ArcGIS, Gephi, Omeka and Voyant Tools
Locating data sources
Applying digital scholarship research methodologies and visualising data
Copyright issues on the use of research data and materials.
On every alternate Tuesday, the Digital Scholarship team does have interesting in-depth discussion and demonstration with academics and postgraduates that come to the Lab. The service will continue in this second semester starting from 16 January 2018 (Tue) on every alternate Tuesday during term time:
CUHK colleagues and students are welcome to visit us for an instant discussion of your research, or email to dslab@lib.cuhk.edu.hk your question for help!
In this post, we share a way of preparing Chinese text data for computational analysis; we do so in R using sample texts from a historical collection that is currently being digitized by our library - the Sheng Xuanhuai Collection.
The Sheng Xuanhuai collection contains over 70 volumes of correspondences between the entrepreneur Sheng Xuanhuai and other individuals. The texts included in the collection are digitized and are preserved in formats of images and text files. The texts are also coded with labels/variables such as title, sender name, receiver name, date, key words and locations mentioned in the texts. The digitization and transcription of the correspondences that transform these texts into machine readable formats allows researchers to conduct studies using computational text analysis and other relevant methods.
In the following sections, we demonstrate our way of importing text data to R, preparing texts for analysis, as well as exploring and visualizing texts. Basic knowledge of R will be helpful if you are to try this practice or even apply this on your own data.
Import Text
First we need to read our data (the texts - csv files are used in this demo) to R - to do so, we use setwd() function to set up the working directory, i.e., let R know the path of where we store the data on the computer, then we use read.csv() to load the data file named v36.csv to R.
# set your working directory
setwd('YOUR WORKING DIRECTORY')
# load the data in a spreadsheet to R
v36 <- read.csv('v36.csv', encoding = 'UTF-8', header=TRUE, row.names=1, stringsAsFactors=FALSE)

# view the first two rows of the data
head(v36, 2)
There are two variables in the data: lid and ltext - they are correspondence letter ID and letter text in volume 36 of the collection. We have 245 rows in this dataset, i.e., 245 letters in this volume.
Segmenting Chinese Text
Words and terms are the basic units of many computational text analysis methods, however Chinese characters are not “naturally” divided by whitespaces like some other languages such as English. A number of methods are developed to segment Chinese characters - here we try the widely used “jieba” segmenter on our sample texts. To use the R version of jieba, install the package by running this command install.packages('jiebaR') in you R Console. Note you also need to run install.packages() for the other packages we use here in the following sections if you haven’t had them installed on your computer.
# load the "jiebaR" and "stringr" packages/libraries
library(jiebaR)
library(stringr)
Initialize an engine for word segmentation, use all the default settings, and try it on a simple sentence.
# initialize jiebaR worker
cutter <- worker()

# test the worker
cutter["今天的天氣真好"]
## [1] "今天" "的" "天氣" "真好"
We then define a function called seg_x by which we segment the texts stored in the ltext variable of the data v36 and save them as a new variable of v36 called ltext.seg.
# define the function of segmenting
seg_x <- function(x) {str_c(cutter[x], collapse = " ")}

# apply the function to each document (row of ltext)
x.out <- sapply(v36$ltext, seg_x, USE.NAMES = FALSE)

# attach the segmented text back to the data frame
v36$ltext.seg <- x.out

# view the first two rows of the data frame
head(v36, 2)
With the texts segmented by whitespaces, we can move on to create corpus and document-term/feature-matrix (DTM/DFM) that are often used for further text analysis. Here we use functions of the quanteda package to create corpus and DFMs, so does to explore and visualize the texts. quanteda is an R package for managing and analyzing text data; it provides tools for corpus management, natural language processing, document-feature-matrix analysis and more.
# load the library
library(quanteda)
We create a corpus from the texts stored in the ltext.seg variable using the corpus() function. We also tokenize the texts using tokens() and construct a document-feature-matrix using dfm(). Note “fasterword” is specified so that the texts are tokenized by whitespaces. We can then view the most frequent terms/features in this set of texts using topfeatures(). The quanteda package also offers a function textplot_wordcloud() by which you can easily plot a wordcloud from DFMs.
# create corpus
lcorpus <- corpus(v36$ltext.seg)
# summarize the lcorpus object
summary(lcorpus, showmeta = TRUE, 5)
## Corpus consisting of 245 documents, showing 5 documents:
##
##   Text Types Tokens Sentences
##  text1    73     82         1
##  text2    82    101         1
##  text3   121    153         1
##  text4    64     70         1
##  text5   171    298         1
##
## Source:  /Users/Guest/Desktop/sheng/* on x86_64 by Guest
## Created: Wed Dec 27 15:14:39 2017
## Notes:
# see the text in the 1st document of lcorpus
texts(lcorpus)[1]
# create dfm with "terms/features" spliting by whitespaces;
# ie, preserve what has done for segmenting by jiebaR

# tokenize:"tokens" from doc 1, split by whitespaces
tokens(lcorpus, what = "fasterword")[1]
# tokenize and create document-feature-matrix
ltokens <- tokens(v36$ltext.seg, what = "fasterword")
ldfm <- dfm(ltokens)

# a dfm with 245 documents and 8052 features
ldfm
## Document-feature matrix of: 245 documents, 8,052 features (98.9% sparse).
# plot wordcloud
par(family='Kaiti TC') # set Chinese font on Mac; you may not need to set font on Windows
textplot_wordcloud(ldfm, min.freq=30, random.order=FALSE,
                   colors = RColorBrewer::brewer.pal(8,"Dark2"))
Combine multiple data files
In the above lines we show how to work with texts stored in one single file, however it is also fairly common that we have texts saved in multiple files. Here we demonstrate how we combine more than one text file in a more efficient way than do it one by one and also some more ways and options of segmenting, exploring and visualizing text data.
Let’s start fresh by removing what we have loaded and created in R.
# remove everything in R environment
rm(list=ls())
We first define a function named multcomb to do the following: 1) list the file names of all the data files that you would like to combine to one file - in this case, we have two csv files to combine, 2) read in the files one by one and rbind them to one data frame.
Save all the data files in one folder, then plug in the path of the folder in the multcomb function to combine all the data files - here we save the combined data frame as mydata.
# define the function of combining multiple files
multcomb <- function(mypath){
  # save all the file names (with path) in an object "filenames"
  filenames <- list.files(path=mypath, full.names=TRUE)
  # import all files and save them as "datalist"
  datalist <- lapply(filenames, function(x){
    read.csv(file=x, encoding='UTF-8', header=TRUE, row.names=1, stringsAsFactors=FALSE)})
  # combine the files (data frames in "datalist")
  Reduce(function(x,y) {rbind(x,y)}, datalist)}
# Use the function multcomb to combine the files in the folder:
# before excecute the function, save all the csv. files in one folder;
# note the folder should not contain other files
mydata <- multcomb('YOUR PATH OF THE FOLDER')
# view the first two rows of mydata
head(mydata, 2)
Segment the words in the combined data file - this time we use stopwords and dictionary to modify the “worker” of segmenting.
# see the stopwords and dictionary
readLines('sheng_stop.txt', encoding = 'UTF-8')
## [1] "" "之" "與" "為" "也" "有" "在" "以" "於" "即" "係"
readLines('sheng_dic.txt', encoding = 'UTF-8')
## [1] "" "經方" "謹上" "滬甯" "京奉" "匯豐" "匯理"
Here we include 10 words in our stopwords list - those we think can be safely filtered out, and we have 6 terms in our custom dictionary so that each of these terms can be segmented as is. It is recommended to use notepad++ to create your custom stopwords lists and dictionaries encoded in UTF-8. Note if you need to use Notepad of Windows to create these text files, it may be easier for R to work with these files if the first rows of each file are left blank - you can see the first elements in my two text files are empty.
# set up and apply the worker and function for segmenting
cutter <- worker(stop_word = 'sheng_stop.txt', user = 'sheng_dic.txt')
seg_x <- function(x) {str_c(cutter[x], collapse = " ")}
mydata$ltext.seg <- sapply(mydata$ltext, seg_x, USE.NAMES = FALSE)

# view the first few rows
head(mydata, 2)
Now we have segmented texts saved in the variable ltext.seg of mydata. We then use functions corpus() and dfm() to create corpus and DFM from ltext.seg and save them as mycorpus and mydfm.
# create and examine corpus
mycorpus <- corpus(mydata$ltext.seg)
summary(mycorpus, showmeta = TRUE, 5)
## Corpus consisting of 335 documents, showing 5 documents:
##
##   Text Types Tokens Sentences
##  text1    73     79         1
##  text2    79     95         1
##  text3   119    148         1
##  text4    62     68         1
##  text5   165    277         1
##
## Source:  /Users/Guest/Desktop/sheng/* on x86_64 by Guest
## Created: Wed Dec 27 15:14:41 2017
## Notes:
# view texts in the first document of the corpus
texts(mycorpus)[1]
Note in this DFM, those terms included in our stopwords list are gone, and those in our dictionary are segmented as in the text file of the dictionary.
We can then generate a data frame indicating frequency of each features using textstat_frequency().
# tabulate feature frequency
dfmtab <- textstat_frequency(mydfm)
head(dfmtab)
Sometimes you only care about, say, longer features/terms, use dfm_select() to choose those meet certain conditions, e.g., terms contain two or more words.
# select 2+ word features
mydfm2 <- dfm_select(mydfm, min_nchar = 2)
topfeatures(mydfm2, 20)
Plot a wordcloud graph from the DFM containing those 2-or-more-word terms. Here we select terms appearing 5 or more times to plot and set 200 as the maximum number of terms to be included.
The function textstat_frequency() can tabulate all feature frequencies like we did above - we can also limit the frequencies to be tabulated and plot these selected features using ggplot() of the ggplot2 package.
# tabulate the top 10 features
textstat_frequency(mydfm2, n=10)
# plot freq. by rank of the most frequent 50 features
library(ggplot2)
theme_set(theme_minimal())
textstat_frequency(mydfm2, n = 50) %>%
  ggplot(aes(x = rank, y = frequency)) +
  geom_point() +
  labs(x = "Frequency rank", y = "Term frequency")
We can also use dfm_weight to create a DFM representing weighted frequencies of the terms, for instance, a DFM with relative feature/term frequencies, i.e., the proportion of the feature counts of total feature counts.
# create dfm with relative term frequencies
dfmpct <- dfm_weight(mydfm2, type = "relfreq")

# plot relative term frequencies
textstat_frequency(dfmpct, n = 10) %>%
  ggplot(aes(x = reorder(feature, -rank), y = frequency)) +
  geom_bar(stat = "identity") + coord_flip() +
  labs(x = "", y = "Relative Term Frequency") +
  theme(text = element_text(family = 'STKaiti'))
In Sum...
In this blog post, we share our way of preparing Chinese texts for computational text analysis, mainly using two R packages - jiebaR and quanteda. We hope this will help our users either to use our Sheng Xuanhuai correspondences collection or to apply this way of processing Chinese texts on your text data. The two packages provide a lot more functions than what we can introduce in this single post, to learn more about the two text analysis packages, start from their documentations at https://qinwenfeng.com/jiebaR/. and http://docs.quanteda.io/index.html.
The Library is pleased to organise the following public talk by Prof. Grace S. Fong of McGill University. All are welcome to join!
Writing and Local Identity: Literary Women of the Pearl River Delta of Guangdong in the 18th and 19th Centuries
Speaker
Prof. Grace Fong
Professor of Chinese Literature, Department of East Asian Studies, McGill University
Visiting Professor, School of Chinese, The University of Hong Kong
Abstract of the talk
On the southern margins of the Qing empire, Guangdong has been seen as an evolving site of regional culture, education, and commerce, particularly in the Pearl River Delta counties surrounding the provincial capital Guangzhou in the eighteenth and nineteenth centuries. While anthropologists have uncovered a working-class women’s culture in this region, educated women from the counties of Panyu, Shunde, Xinhui, and Zhongshan were a significant but as yet understudied part of the elite culture.
Using data on Guangdong women in the Ming Qing Women’s Writings database and digital archive (http://digital.library.mcgill.ca/mingqing/) as primary sources for comparison, this paper aims to explore the relationship of these women’s writing to the construction of regional culture and identity before the Western powers had a significant impact through trade and missionary efforts beyond the Canton trading zone. To what extent were literary women part of a regional culture in Guangdong in the eighteenth and nineteenth centuries? Using both biographical and textual data and examining the paratexts, poetic themes and topics, and regional and social networks contained in fifteen individual works by Qing women writers from Guangdong, I will examine how a regional or local culture might have been constructed in these textual productions, and to ask how the components of this regional women’s culture – the hopes and desires, social and cultural activities, reflections and ambitions of these women in the Pearl River Delta show differences from or similarities to their contemporaries, the well-known elite educated women in the cultured Yangzi River Delta.
Date: 10 Jan, 2018 (Wed) Time: 4:00 – 5:30 p.m. Venue: Digital Scholarship Lab, G/F, University Library
On
31 March 2017, the CUHK Library organized the first Digital Scholarship Symposium with the theme “Exploring Digital
Scholarship Research at CUHK and Beyond” that was held at the Digital
Scholarship Lab, G/F of University Library. Six speakers from different disciplines presented their latest digital
scholarship projects, attracting over 60 researchers, research students and librarians. As a 1st anniversary event of the Digital Scholarship Lab, the Symposium aims at providing an avenue for all scholars interested in and conducting research in digital scholarship to get together to share their research, to further spark off more research in this area, and to enhance the partnership between the CUHK Library and the Faculty in conducting and supporting digital scholarship research.
The Symposium was officiated by Prof. Fanny M.C. CHEUNG, Pro-Vice-Chancellor/Vice-President and Ms. Louise JONES, University Librarian of CUHK. There were six presentations on network analysis, data visualization, GIS and big data analysis. They were:
The post-symposium workshop in the afternoon by Dr. Tsui introduced the use of China Biographical Database (CBDB) and incorporation in other tools such as MARKUS for China studies. The
digital tools presented in the workshop sparked very lively discussion among
participants. More photos about the symposium can be found here.
The Library is very grateful for the enthusiastic support from the Faculty and the participants. The Library will continue to support research activities across the entire research life cycle by leveraging the latest digital technologies.
Last week we have introduced some use of GIS in visualizing different types of data. In CUHK there are some researchers having used GIS in visualizing their research projects. Here we will introduce a few examples.
The aim of SpatioEpi is to popularize the study of geographic distribution of health conditions, disease and environmental factors as they relate to the human population. In fact they have produced many maps displaying spatial data on current issues, e.g. the recent (Dec 2016) smog in China: Smog the silent killer.
The project is done by Prof. Sidney Cheung from Department of Anthropology. It is a "knowledge transfer project" in which an anthropological perspective was used to show how the knowledge of the local community about Sheung Wan is "transferred" to visitors "for a better understanding of Hong Kong". It made use of 3 "vitural tours" to show people how the streets looked like with the scenes of all the shops in the street: Wing Lok Street, Ko Shing Street (selling Ginseng, dried seafood, etc.) and Bonham Strand West (selling Chinese herbs).
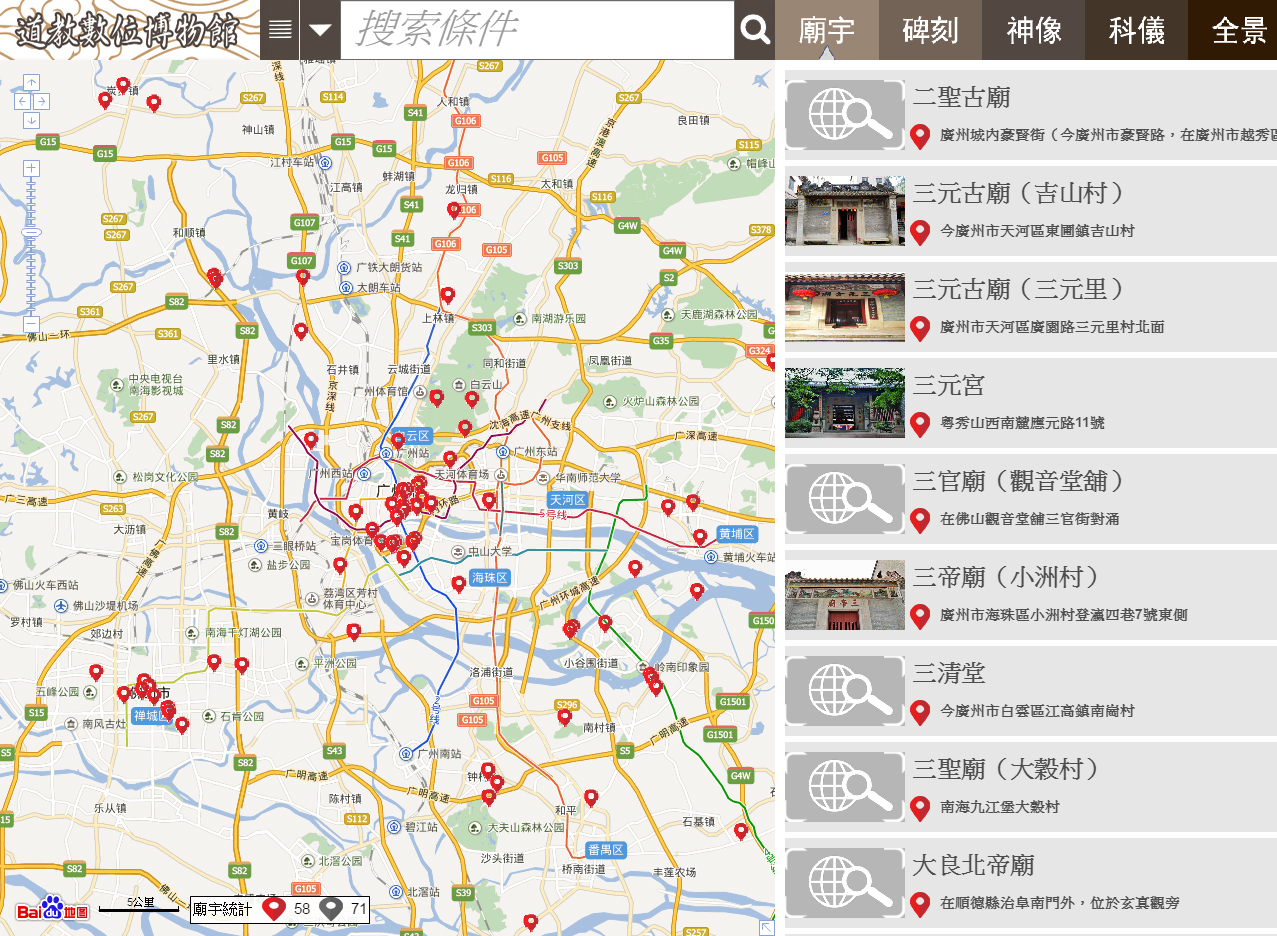
Developed by Prof. LAI Chi-tim and his research team from Centre for Studies of Daoist Culture, the website is the first “Daoist Digital Museum” in the world. They used WebGIS to display the geographical locations of the Daoist temples in Guangzhou, no matter they still exist or not, and embed them with images, videos, digital texts about the temples. Their aim is to help "scholars of Daoism, Chinese religion and even historians interested in the city of Guangzhou to perform quantitative analyses of the geographic distribution of temples in Guangzhou and on their relationship with the surrounding socio-economic environment, changes in population and environment, by tracing the development of particular temples."
Sometimes when no GIS application can be used, spatial data can still be visualized in an interesting way. A project from the I.CARE of CUHK used hand-drawing map to display the Sha Tau Kok town and its community facilities: 「社區探索 - 博群沙頭角長者服務計劃」(in Chinese only).
Although it does not involve the use of GIS software and application, and as a matter of fact, Sha Tau Kok town is frontier closed area (FCA) and there is no street view available yet in Google map, the hand-drawing map will also enable people who have not been to the area before to have a basic impression about the town.
GIS can be used in all subject areas, as it helps visualizing data with spatial aspect, and some powerful software can help performing analysis, which helps researchers in digging out important trends behind the data.



 7:04 PM